
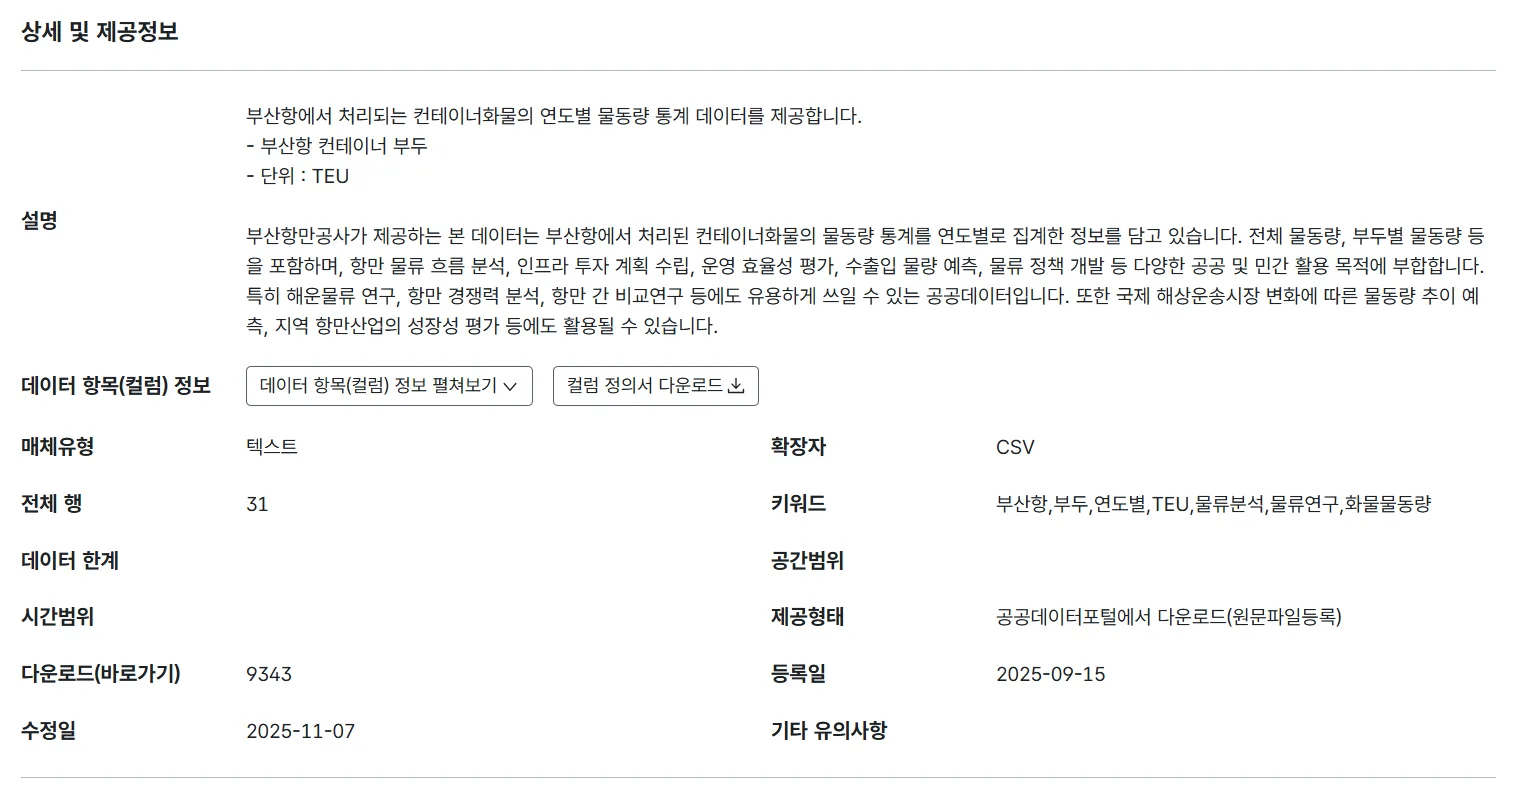
This time I pulled real data from Busan Port Authority instead of practice data. At first I thought I’d get it directly from Busan Port Authority, but it turns out public data is managed through the Public Data Portal. So to get Busan Port Authority data, you have to go through the portal.
I went to Public Data → Data List on the Public Data Portal and searched with “Busan Port Authority” as the keyword. There I downloaded Busan Port Authority_Busan Port Container Transport Statistics as a CSV.
Table of contents
Open Table of contents
- I wasted time on environment setup
- Skimming the container transport statistics
- I didn’t know what the sum was a sum of
- Scaling down units and looking at growth rate
- I scrapped the question
- Vessel arrival/departure data — stuck on encoding right away
- Calculating berthing time
- The filter came back all False
- Summary
- Things to study further
I wasted time on environment setup
I set up the initial environment with uv init and uv add, but I spent a while because I mistyped ipykernel as ipkernel.
PS C:\dev\d1> uv add pandas ipkernel numpy
Using CPython 3.14.7 interpreter at: C:\Users\user\AppData\Local\Programs\Python\Python314\python.exe
Creating virtual environment at: .venv
  ╰─▶ Because ipkernel was not found in the package registry and your
      project depends on ipkernel, we can conclude that your project's
      requirements are unsatisfiable.

hint: If you want to add the package regardless of the failed resolution, provide the `--frozen` flag to skip locking and syncing
The message was telling me exactly “there’s no such package in the registry,” but I misread it and assumed it was an environment problem. When it says it can’t find a package name, the first thing to suspect is a typo.
I created a new notebook called analysis.ipynb, wrote the path into a constant named D001_PATH, then loaded it with pd.read_csv(D001_PATH).
Skimming the container transport statistics
I went through this in the order I laid out in the previous post.
Running df.head(5) showed five rows starting from 1994. If a terminal was built more recently, you’d expect missing values for the years before it existed, but those were filled with 0 as well.
df.shape was (31, 15), which matched the portal’s “total rows: 31.”
Checking df.dtypes showed everything was integer type. If there were missing values, NaN would have forced the columns into float type — since they’re integers, I could infer there were no missing values.
I also checked df.info(). With 31 rows, this is 31 years of data.
There’s one thing worth noting here: the year is stored as a number, but it’s not data meant to be summed or averaged. It’s a time axis, and it can serve as an index identifying each record. Data arranged along the flow of time like this is called time series data.
Getting an overview all at once
Instead of checking each step separately, you can bundle everything into one view.
pd.DataFrame({
    "자료형": df.dtypes.astype("str"),
    "비결측 수": df.notna().sum(),
    "결측 수": df.isna().sum(),
    "결측률(%)": df.isna().mean() * 100,
    "고유값 수": df.nunique(dropna=True)    # 결측치 빼고 고유값만
})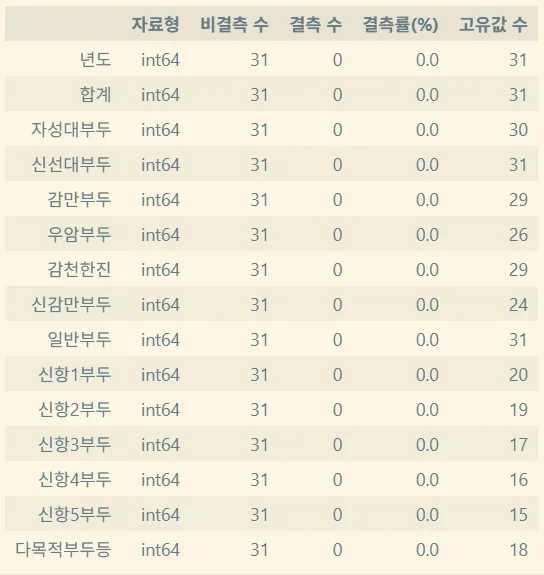
Printing it this way lets you see an overview of the data in one screen. Looking at the unique value counts, the new-port terminals have low counts of 20 or fewer, because they were built later and the earlier years are all filled with 0.
Now that I’d checked for missing values, it was time to look at descriptive statistics. But just running df.describe() looked messy. Transposing with df.describe().T made it at least readable. Transposing is useful not only when axes get confusing, but in cases like this too.
I didn’t know what the sum was a sum of
As I skimmed through, something bothered me. The columns just listed terminal names in a row with no units. I couldn’t tell from the file alone what the “합계” (total) column was summing.
Looking into it, everything was written on the portal’s detail page. The description field said unit: TEU, and there was also a separate column definition document available for download. In other words, the metadata wasn’t missing — it just wasn’t inside the CSV file. If you only keep the file, you’ll end up just as confused the next time you open it.
So I decided to write up metadata myself, right next to the data. It’s good to note what the units are and what each code means. It doesn’t seem like much right now with only 15 columns, but this memo is what’ll save me when I open this data again later.
Scaling down units and looking at growth rate
The totals were so large they showed up in scientific notation like e+05. So I cut them into bands to categorize them.
total = df["합계"]

total_band = pd.cut(
    total,
    [0, 5_000_000, 10_000_000, 15_000_000, 20_000_000, float("inf")],
    labels=["500만 이하", "500만~1000만", "1000만~1500만", "1500만~2000만", "2000만 초과"]
)
Then I set a reference point and sliced from there.
df[df["년도"].ge(2000)]The reference point of 2000 was my own choice. My goal was to calculate the year-over-year growth rate from 2000 onward to see how much it had grown. I stored this dataframe in stable.
stable["합계"].pct_change() # 전년도 기준 증감률Since it’s calculated relative to the previous year, the first value comes out as NaN. So I added dropna().
stable["합계"].pct_change().dropna()But the year-to-year data had too much variance, and using this to say anything about port throughput seemed likely to understate the real picture.
I scrapped the question
What I originally wanted to look at was annual cargo volume to gauge Busan Port’s efficiency, but I concluded this data wasn’t suited for that.

I decided it would be better to look at which port showed the highest frequency of use. By computing the total across all terminals and the total across New Port terminals, and seeing which one is used more, I could tell which port to use for efficient container transport.
terminal_col = []

for column_name in df.columns:
    if column_name not in ["년도", "합계"]:
        terminal_col.append(column_name)
new_port = []
for column_name in df.columns:
if column_name.startswith("신항"):
new_port.append(column_name)This way, I stored all terminal names and New Port names separately. Now, the totals.
df[terminal_col].sum(axis=1)    # 연도별 부두 합계
df[new_port].sum(axis=1)        # 연도별 신항 합계
Since I need one value per row, it’s axis=1. This is exactly where the thing I was confused about in the previous post came in handy.
I added these totals as derived variables, and also added a New Port share column by dividing the New Port total by the overall terminal total.
df_1[["년도", "부두합계", "신항합계", "신항비중"]]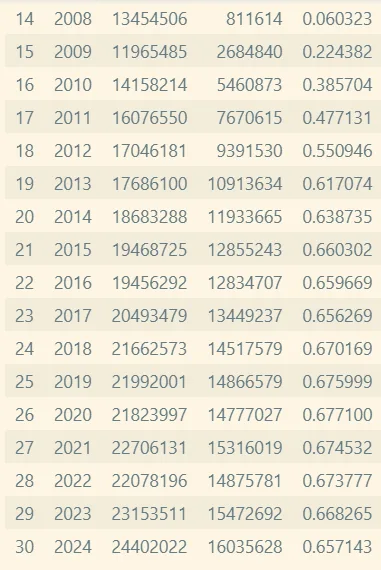
I expected the share to keep rising after the New Port was built, but it rose to a certain level and then held steady. It hit 0.66 in 2015, and has stayed between 0.65 and 0.68 for nearly ten years since.
From the data, I can tell that container volume share has been stagnant from a certain point onward. But I don’t know why it’s stagnant from this data alone. I’d need to look at other data.
There are two more things worth trying. To see which terminal 2024’s cargo volume is concentrated in, I could look at the max value by year, and I could answer when New Port became the center of Busan Port directly from the share I just calculated.
Vessel arrival/departure data — stuck on encoding right away
This time I downloaded Busan Port Authority_Vessel Arrival and Departure Aggregate Information.
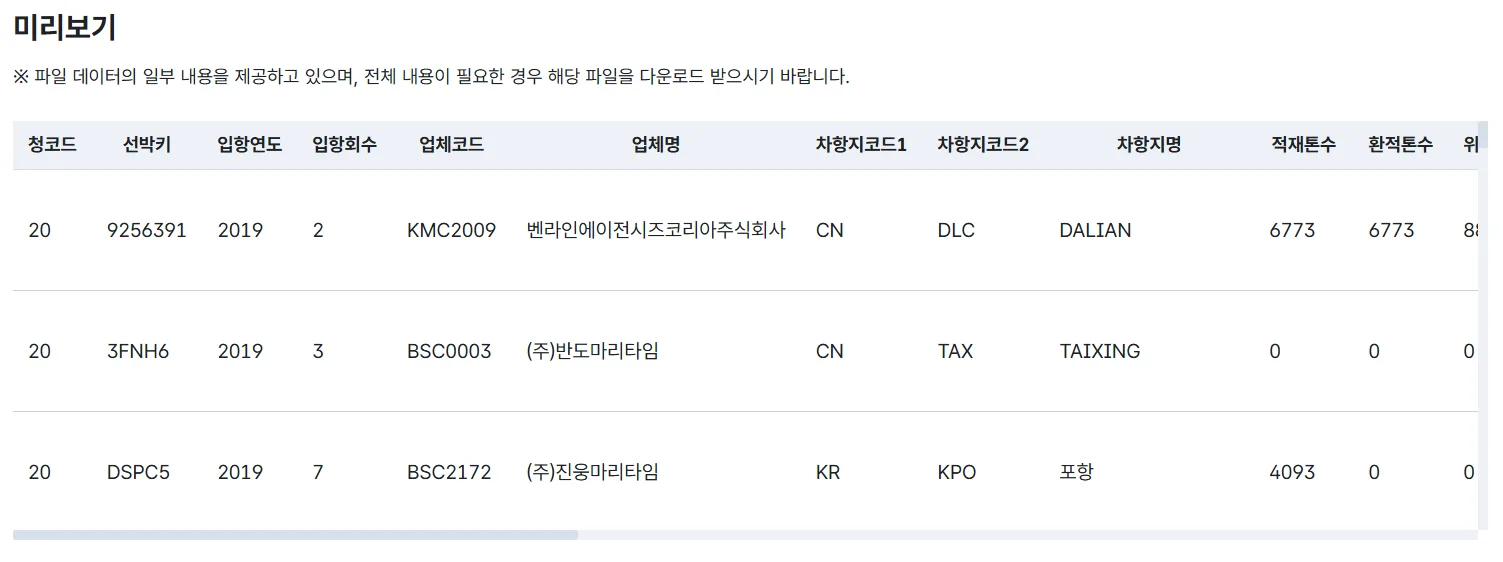
First I sorted out the terminology.
- 차항지 (next port): where it’s headed
- 전출항지 (previous departure port): where it came from
But I got an error the moment I tried to read it.
UnicodeDecodeError: 'utf-8' codec can't decode byte 0xc4 in position 2: invalid continuation byteread_csv reads as UTF-8 by default, but this file was encoded in CP949 (an EUC-KR variant). It hit a byte that couldn’t be interpreted as UTF-8 and broke. Specifying the encoding fixes it.
pd.read_csv(FILE_PATH, encoding="cp949")Reading the error message again, the answer is right there. “There’s a byte the utf-8 codec can’t read” means the file isn’t UTF-8.
Missing values split the data
I checked with df.head() and df.shape, then looked at df.info(), and noticed the non-null count varied by column. I reused the summary table I’d made earlier.
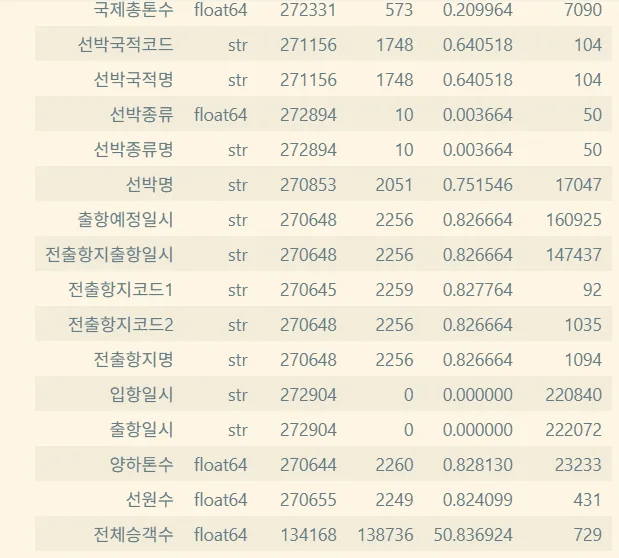
The missing rate for total passenger count is unusually high at 50.8%. This seems to be because passenger ships and cargo ships are mixed into a single table. There’s no reason for a cargo ship to have a passenger count. That made me think this missingness might even be usable to split the data into passenger-ship rows and cargo-ship rows. It needs to be verified, though.
Running df.describe().T showed something off. The total tonnage is large, but the unloading tonnage and transshipment tonnage are oddly small. Unlike the earlier dataset, there are missing values here too, and they need to be handled.
Calculating berthing time
I put off dealing with missing values and started with the easier part: berthing time — how long a ship stays at port.

to_datetime() handles converting a string to datetime.
pd.to_datetime(df["입항일시"])The arrival datetime had no missing values, so this worked in one go, but when there are missing values, you need to add a parameter.
pd.to_datetime(df["입항일시"], errors="coerce")After conversion, the strings that used to be year-month-day-hour-minute became datetime values down to the second. The departure datetime also had no missing values, so I did the same thing.
Subtracting the arrival time from the departure time gives a series, but it comes out as “X days Y hours” rather than plain hours.
0         1 days 00:00:00
1         0 days 15:00:00
2         0 days 10:00:00
3        11 days 13:45:00
4         0 days 16:00:00
               ...
272903   14 days 00:00:00
Length: 272904, dtype: timedelta64[us]
I converted this to seconds, using dt.total_seconds() on the series.
0           86400.0
1           54000.0
2           36000.0
3          999900.0
4           57600.0
            ...
272903    1209600.0
Length: 272904, dtype: float64
Dividing this by 3600 gives the berthing time in hours.
The filter came back all False
Looking at the berthing times, there were some that were unreasonably long. I thought they were problematic data and tried to filter them out.
invalid = arrival.dt.year.eq(df["입항일시"]) & stay.between(0, 24 * 30)

invalid
0 False
1 False
2 False
3 False
4 False
...
272903 False
Length: 272904, dtype: boolEverything came back False. Since nothing got flagged, I figured there was no problematic data and moved on.
But when I built a summary table later, the story was different.
pd.Series({
    "원본 행 수": len(df),
    "입항연도와 입항일시 연도 불일치": df["입항일시"].dt.year.ne(df["입항연도"]).sum(),
    "음수 체류시간": df["체류시간"].lt(0).sum(),
    "30일 초과 체류시간": df["체류시간"].gt(24 * 30).sum(),
    "유효 체류시간 비율": valid_stay.mean() * 100,
    "완전중복행": df.duplicated().sum()
})
원본 행 수 272904.000000
입항연도와 입항일시 연도 불일치 214.000000
음수 체류시간 19.000000
30일 초과 체류시간 4838.000000
유효 체류시간 비율 98.153197
완전중복행 0.000000
dtype: float64There were 4838 cases where the stay exceeded 30 days. It was strange that nothing had been flagged earlier.
The cause was in the earlier condition expression. arrival.dt.year is a year, so it’s an integer, but I compared it against df["입항일시"], which is a datetime type. The things being compared were mismatched from the start.
What’s worth pointing out here is that this didn’t throw an error. I checked it directly.
s = pd.Series(pd.to_datetime(["2019-01-01", "2020-05-05"]))
y = s.dt.year

y.eq(s)   # [False, False]  — 조용히 전부 False
y > s     # TypeError
== or .eq() doesn’t raise an exception when types don’t match — it just quietly returns all False. If it had been an inequality operator, it would have blown up immediately with a TypeError. And since this False was joined with &, whatever came after it, the result was always going to be all False.
What I’d meant to compare was the year extracted from the arrival datetime against the separate arrival-year column. What I used in the summary table was the correct form.
arrival.dt.year.ne(df["입항연도"]) # 214건A result of “nothing got flagged” should not be taken as proof that the data is clean. A filter that doesn’t work and a filter with nothing to catch look identical on screen. If I had split the condition apart and counted each piece separately, it would have been obvious right away — but I didn’t do that.
I’m the one who sets the threshold
I also wrote down my criteria for outliers. Subtracting the scheduled departure time from the actual departure time gives the departure delay, and this can come out negative when a ship left earlier than scheduled — I don’t treat that as a delay.
The 30-day berthing threshold is a line I drew because it looked like it reflected ships stuck undergoing repairs. It’s not a value fixed by the data — it’s a criterion I set myself.
Even when data looks like it’s filled in properly, contradictory values like these can be mixed in. They need to be masked and filtered out carefully.
Summary
- The Public Data Portal’s detail page has the units and column definitions. They’re not in the CSV file, so write them down separately alongside it
- If the data doesn’t fit the question you set, change the question. I switched from looking at efficiency via cargo volume to New Port share
read_csv’s default encoding is UTF-8. Domestic Korean public data is often CP949- If a filter result comes back all
False, suspect the condition expression before you suspect the data
Things to study further
- How pandas comparison operators handle type mismatches —
==quietly returnsFalse, while inequality operators raisedTypeError. I want to understand why they’re handled differently, and whether there’s a way to catch mistakes like this ahead of time. → pandas: Comparisons - Whether it’s valid to split data by missingness pattern — if I want to treat missing total passenger counts as indicating cargo ships, I need to confirm that the missingness really means “not applicable.” Apparently how you handle it depends on why the value is missing in the first place. → Working with missing data
- The difference between
pd.cutandpd.qcut— this time I manually cut bands in units of 5 million, but there’s also a way to cut by quantile. I want to know which situation calls for which. → pandas.qcut - Ways to look at growth other than
pct_change()— the year-to-year variance was too large to judge anything from year-over-year change. I want to look into metrics used for growth across multiple years, like CAGR. → pandas.DataFrame.pct_change - How to build a data dictionary — I want to see what format is standard for recording units, code meanings, and collection frequency per column. Right now I’m just planning to write it in markdown, but there’s probably a set format for this.
- Why has the New Port share plateaued? — this data alone doesn’t answer it. I’d probably need to bring in other data like berth capacity or the number of berths.