
In FEMS #1, I did the setup and a 5-chunk demo. Today: growing the corpus with real data + a quality gate + comparing models.
Table of contents
Open Table of contents
- PDF Text Extraction — The Hangul-Corruption Trap in
pypdf - Building the Corpus — About 230 Pages
- Indexing Pipeline
- Quality Gate — Defining and Limiting
readable_ratio - Defining Normal vs. Anomaly — Wait, Why Did I Collect Real Data Again?
- 3-Backend Comparison (Round 1) — First Question Synthetic, Second Question a Real Guideline
- The Trap — Chinese Character Mixing and Generation Collapse in qwen2.5:7b
- First Fix — Locking Temperature and the System Prompt Language
- Second Fix — exaone3.5:7.8b (Korean-Specialized)
- Retrospective
- Things to Study Further
PDF Text Extraction — The Hangul-Corruption Trap in pypdf
I extract PDF → text using pypdf. But there’s a trap you fall into once when handling Korean PDFs:
Due to encoding display issues in the PowerShell console, Hangul can appear corrupted.
It often looks broken when printed to the console, but is perfectly fine once saved to a file. If you judge “the extraction is broken” just by looking at the console, you end up chasing the wrong problem for a while. So I verify using a combination of the file-saved output — not the console — plus the readable_ratio described below, plus keyword extraction.
Building the Corpus — About 230 Pages
I gathered public materials:
- Korea BEMS Association — 2 official FEMS guideline documents
- Korea Energy Agency’s public data room — FEMS installation verification standard guide
- UCI — Steel Industry Energy Consumption dataset
I ended up with about 230 pages plus roughly 35,000 rows of actual measurement data. That’s a real jump in scale from the 5-chunk demo in #1.
Indexing Pipeline
| Stage | Tool |
|---|---|
| PDF → text | pypdf |
| Chunking | Paragraph-based, target 800 chars |
| Embedding | Ollama bge-m3 (1024 dims) |
| Vector DB | Chroma |
The AI split the chunks and even ran query tests automatically end to end — but I was skeptical whether this would actually hold up in a real service environment without breaking. So I added a step to directly check chunk size distribution and indexing integrity.
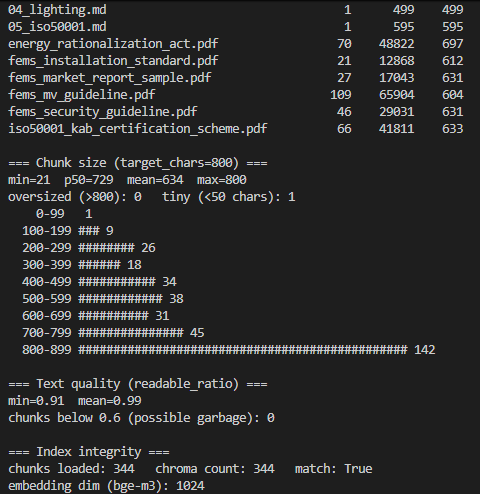
What I confirmed:
- 344 chunks total (matches chroma count, match: True)
- Chunk size distribution — min=21, mean=634, max=800 (target 800 well respected, oversized 0)
- readable_ratio average 0.99 (mean), min 0.91
- Integrity OK, but I found that some chunks had low quality
Quality Gate — Defining and Limiting readable_ratio
The first filter I built to catch what low-quality chunks look like:
readable_ratio= (count of complete Hangul characters + count of printable ASCII characters) / total character count
def is_readable(ch):
    code = ord(ch)
    is_hangul = 0xAC00 <= code <= 0xD7A3
    is_ascii  = 32   <= code <= 126
    return is_hangul or is_ascii
For normal text, this comes out close to 1.0. Chunks with broken fonts, or table-of-contents pages consisting mostly of dotted lines and page numbers, get a lower ratio.
Finding — Table-of-Contents Pages Got Caught
Most of the chunks flagged as low quality were table-of-contents pages. Lots of dotted-line patterns (........... 12) pulled the ratio down — and this is exactly the kind of content where the ratio can be fine but the RAG value is zero.
The Limits of This Method — What It Can’t Catch
readable_ratio isn’t a silver bullet. Cases it misses:
- Chunks where the characters are fine but the content is thin (table of contents, page headers, cover pages)
- Cases where the font maps to the wrong Hangul characters (the characters themselves are still complete, so the ratio scores perfectly)
To catch these properly, you’d need a combination of ratio + chunk length + language detection + LLM-based quality checks. But — for this project right now, that would be over-engineering, so I didn’t adopt it.
| Method | Why I skipped it |
|---|---|
langdetect / fastText language detection | The ratio function already catches table-of-contents pages well enough |
| LLM-based quality checking | Expensive and slow |
| Excluding entire low-quality documents | Only the TOC pages are low quality — no need to throw out the rest of the document too |
Conclusion — 116 → 109 (7 Excluded)
Out of all chunks, only 7 low-quality chunks were excluded. I got the intended effect without dragging in heavier tooling.
Defining Normal vs. Anomaly — Wait, Why Did I Collect Real Data Again?
Moving on to distinguishing normal / anomaly patterns on top of the RAG setup I built.
To properly define “normal,” I split lighting states into two categories:
- idle (nighttime / weekends — low power)
- active (business hours — high power)
Lighting power dropping at night or on weekends is not an anomaly — it’s normal. Without this distinction, even normal patterns get flagged as anomalies. I defined normal/anomaly criteria for compressor and HVAC spike values the same way.
Synthetic Data vs. Real Data — A Question of Overfitting
I generated a test CSV to measure whether the model could find a signal in the data. I confirmed that anomalies deviated significantly from normal. I decided a step of manually reviewing and verifying normal/anomaly by a human was needed.
This raised a question:
If I’m just running experiments with injected anomalies and asking questions tailored to synthetic data, what was the point of collecting the actual PDFs?
The synthetic data’s answers matched the questions too neatly, so there was no way to verify whether the real PDFs would actually be usable in the field. I concluded this creates an overfitting problem.
→ I decided that all subsequent verification would use a handful of test questions I wrote myself.
3-Backend Comparison (Round 1) — First Question Synthetic, Second Question a Real Guideline
python -m scripts.run_analysis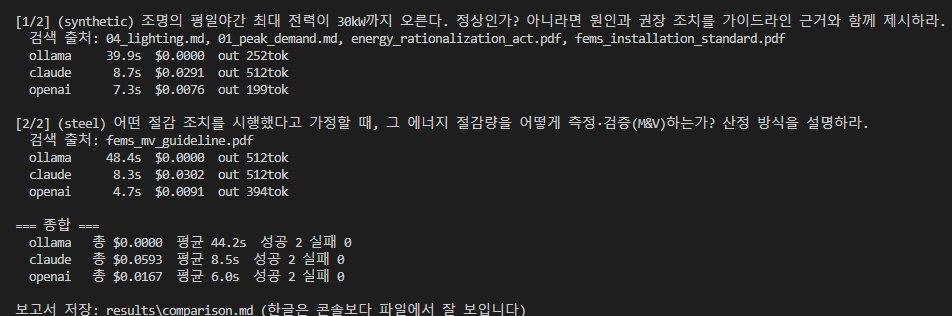
| Provider | Model | Avg latency | Total cost | Success/Fail |
|---|---|---|---|---|
| ollama | qwen2.5:7b | 44.2s | $0.0000 | 2/0 |
| claude | opus-4-8 | 8.5s | $0.0593 | 2/0 |
| openai | gpt-4o | 6.0s | $0.0167 | 2/0 |
All three tied on accuracy. The differences show up in the quality of the write-up and in latency/cost.
- The best-organized answer came from Claude — it explains things broken into “Judgment / Cause / Recommended Action” sections. Though the response got cut off due to the output token limit.
- qwen2.5:7b loads slowly (44s average), while Opus is expensive but produces excellent write-up quality.
The Trap — Chinese Character Mixing and Generation Collapse in qwen2.5:7b
I took a closer look at the ollama response to the second question (about ETRI / fems_mv_guideline.pdf):
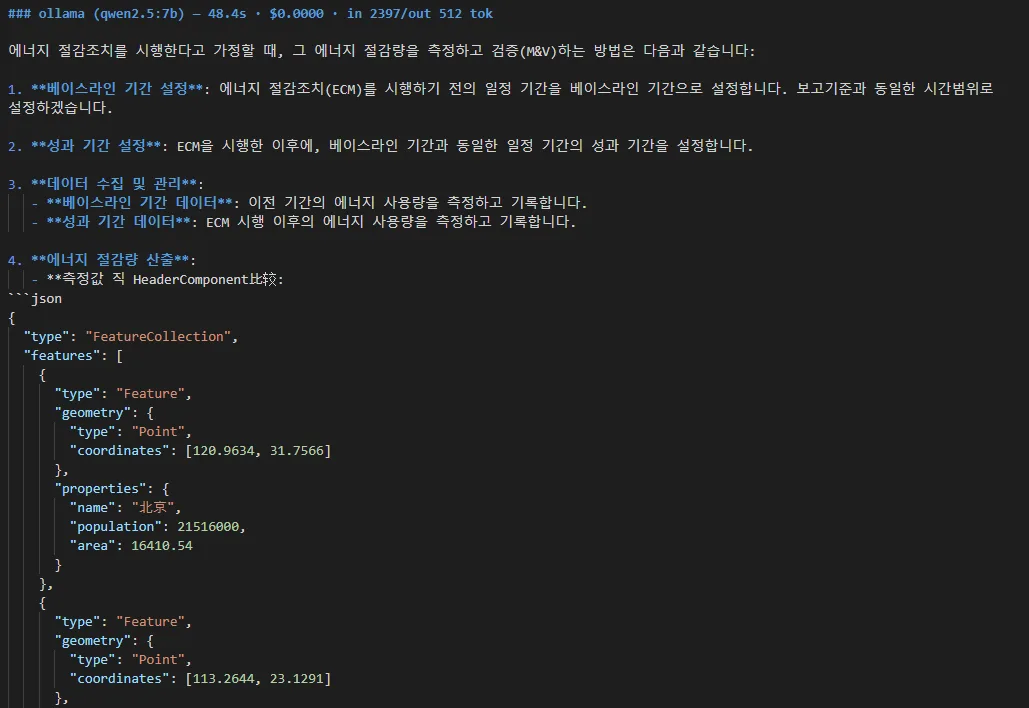
The answer starts out fine, but partway through:
- Chinese characters got mixed in (things like
HeaderComponent比较,测定值) - Suddenly Beijing / Shanghai coordinates as GeoJSON popped up — completely unrelated to the question
This is actually two problems:
- Language mixing (code-mixing) — a phenomenon where an unintended language bleeds into the output
- Generation collapse — a phenomenon where the model slides into a pattern common in its training data
This is the result of the model sliding into a pattern it saw often in training data (e.g., GeoJSON examples). It’s a kind of attractor the model falls into as a “safe path.”
First Fix — Locking Temperature and the System Prompt Language
Ollama’s default temperature is 0.8. Lowering it supposedly reduces the chance of derailing. At the same time, I explicitly specified in the system prompt to “answer in Korean.”
After applying temperature / repeat_penalty to OllamaProvider plus the language lock in the prompt, I reran it:
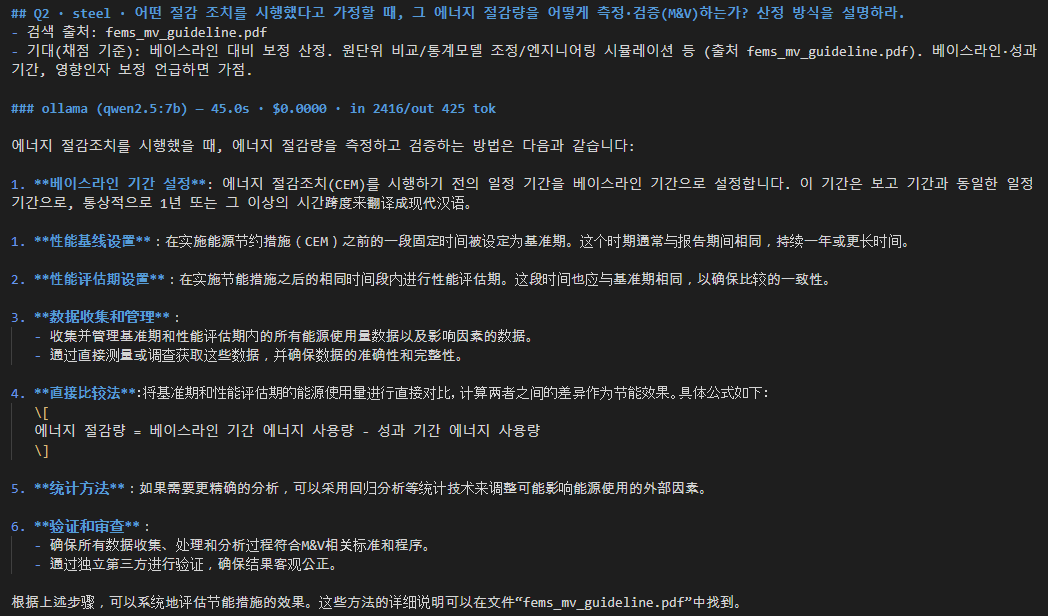
An unexpected result:
- Derailment (unrelated output like GeoJSON) → gone ✅
- Chinese character mixing → actually got worse ❌ (half the response was in Chinese)
Lowering temperature makes the model pick the “most likely” token — and since qwen2.5:7b is a model from China, its probability distribution itself seems to lean toward Chinese.
→ When picking a local LLM, “robustness against language mixing” becomes a key criterion. You need to monitor the model lineup ahead of time and compare candidates.
Second Fix — exaone3.5:7.8b (Korean-Specialized)
While on the subject, I tried exaone3.5:7.8b (a Korean-specialized model from LG AI Research).
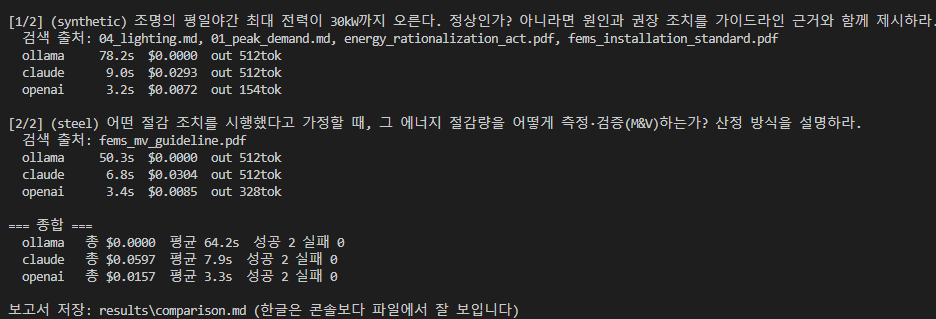
- Clean Korean ✅
- No derailment ✅
- Loading took a bit longer, but the results came out fine
- However, the answer got cut off due to the output token limit → I need to raise
max_tokensor specify “answer concisely” in the system prompt
Retrospective
Three key takeaways from today:
- Push the quality gate right up to the edge of over-engineering, no further — a single
readable_ratiowas enough to catch the 7 TOC-page chunks. langdetect / LLM quality checks have low cost-effectiveness here. - Asking only questions tailored to synthetic data makes collecting real data pointless — to verify whether the RAG actually makes use of the real PDFs, a human needs to write questions based on the real data themselves.
- When picking a local LLM, “robustness against language mixing” becomes a first-tier criterion — temperature alone couldn’t fix qwen2.5:7b’s Chinese-character mixing and generation collapse. A Korean-specialized model (exaone) was the immediate solution.
I’ve gotten a sense that increasing chunk count isn’t the be-all and end-all.
Things to Study Further
1. Criteria for Selecting Vector DB Data
Keywords that came up in today’s retrospective:
- Relevance — does it fit the domain and use case?
- Quality — exclude broken text / empty chunks
- Authority / reliability — is the source clear?
- Appropriate granularity — too narrow loses relevant info, too broad adds noise
- Removing duplicates / outdated versions — if the same info is scattered across multiple chunks, retrieval quality suffers
The key is selecting data to fit the domain and use case — just dumping everything in isn’t the answer.
2. Deeper Chunking Strategy
- Fixed-size vs. Recursive vs. Semantic — which fits which domain
- Overlap ratio — trade-offs between 0 / 10% / 20%
- Sentence-level embedding + hierarchical retrieval — a two-stage approach with chunks and sentences
- Separate handling for special content like tables / code / equations
3. Local Model Catalog + Korean-Specialized Models
- qwen2.5 / llama3.x / mistral / phi — the Korean-language weaknesses of global models
- exaone3.5 (LG AI Research) — Korean-specialized, various sizes
- HyperCLOVA X (NAVER) — closed, API-based
- KO-Llama / community Korean fine-tuned models — community variants
- Benchmarking Korean Q&A on the same corpus (BLEU / Rouge / Korean BAS, etc.)
4. The Mechanics of Generation Collapse
- What the “common pattern attractor” in training data actually is
- Why it happens more at low temperature
- The effects of top-p sampling / repetition_penalty / frequency_penalty
- Cases where CFG (Classifier-Free Guidance) is applied to LLMs
5. Handling Token Limits and Truncated Responses
- Blindly raising
max_tokenscauses latency + cost to explode - The effect of specifying “be concise” / “key points only” in the system prompt
- The streaming continuation pattern of splitting a response into multiple parts
- Constraining output format to JSON / tables to control length
6. Embedding Human Domain Knowledge into Anomaly Definitions
- Rules like “idle at night/weekends is normal” can only be known by domain experts
- Separating normal patterns by time-of-day + day-of-week + per-equipment
- Simple statistics (mean + 3σ) vs. context-aware (conditional distributions)
- How FEMS’s real-time monitoring evolved from simple threshold alarms to context-aware alarms