
Following Series, I looked at DataFrame.
Table of contents
Open Table of contents
Making a table in Python
First I made a table in markdown.
|메뉴|가격|판매량|
|---|---|---|
|아메리카노|4500|152|
|카페라떼|5000|98|
|바닐라라떼|5500|67|
|카푸치노|5000|45|
Can this table be made with plain Python syntax alone? You can use a dictionary.
data = {
    "메뉴": ["아메리카노", "카페라떼", "바닐라라떼", "카푸치노"],
    "가격": [4500, 5000, 5500, 5000],
    "판매량": [152, 98, 67, 45]
}
This is one way of expressing structured data in Python. If you put this straight into DataFrame, you get a table.
df = pd.DataFrame(data)
df
메뉴 가격 판매량
0 아메리카노 4500 152
1 카페라떼 5000 98
2 바닐라라떼 5500 67
3 카푸치노 5000 45A DataFrame is ultimately a bunch of columns joined together. The menu column + the price column + the sales column. That’s why I learned Series first.
Series is 1-dimensional and DataFrame is 2-dimensional. You can check this with ndim, which I covered in the Series post.
Pulling out rows, pulling out columns
Since a DataFrame is several columns stuck together, getting one record means pulling information from every column.
Rows are pulled out with loc / iloc, same as with Series.
delivers.loc[0]Pulling a row out this way returns an object Series. Since columns have different dtypes, pulling out by row almost always ends up as object. So it seems important to only pull out what you actually need.
Columns are pulled out by putting the name in square brackets.
delivers["delivered"]Unlike loc, this pulls out the column information as a Series.
To pull out a single value by matrix position, you pass two values to iloc.
df.iloc[2, 0]Start by checking the shape
The most important thing about a DataFrame is its shape.
delivers.shape(3, 4)This returns a tuple in row, column order. 3 rows and 4 columns means 3 records with 4 attributes each.
There are two kinds of index. The DataFrame’s own index refers to row numbers, and column names can also act as an index.
df.index     # RangeIndex
df.columns   # column names
If you want to attach custom indexes instead of RangeIndex, you do it the same way as with Series.
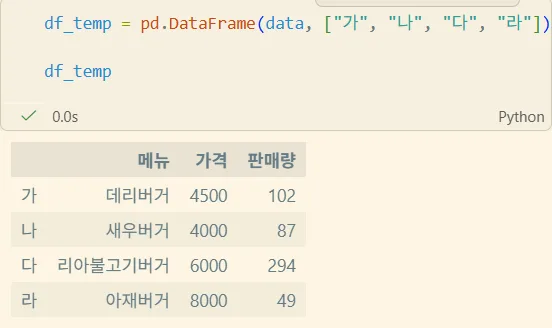
When you make several Series and combine them into a DataFrame, you pass them in as a dictionary, not an array. It’s standard to express which column each Series belongs to as a dictionary and pass that in.
If I’m only doing data analysis, I’ll probably never need to build a DataFrame from scratch myself. It seems enough to just know that this is how it’s done when I need to pull a Series out of the original data and build a new DataFrame.
Derived variables
You can create a derived variable by pulling out columns and doing arithmetic on them.
df['quantity'] * df['unit_price']0 1350000
1 560000
2 150000
dtype: int64I multiplied two Series together and the result is also a Series.
To attach this to the existing DataFrame, you assign a name for the new column and put the values in.
df['total'] = df['quantity'] * df['unit_price']Pulling out as a Series vs. as a DataFrame
Selecting several columns at once works the same way as with Series. With Series you gave an array of indexes; with DataFrame you give an array of column names.
df[['quantity', 'unit_price']] quantity unit_price
0 1 1350000
1 2 280000
2 3 50000Here’s something that tripped me up. If you wrap even a single column name in an array, you get a DataFrame; if you don’t, you get a Series.
| Notation | Result |
|---|---|
df['quantity'] | Series |
df[['quantity']] | DataFrame |
When you pull it out as a Series, you get it as an element; when you pull it out as a DataFrame, you get it as an array. So which one you use depends on where you’ll use it. If you’re going to use a single column for a calculation, comparison, or filter condition, pull it out as a Series. If you need to preserve the table structure, pull it out as a DataFrame.
The dtype lives in the column, not the table
A table itself has no dtype. It lives in the column. That’s why it’s hard to see at a glance what dtypes are inside a table, and why you need a separate way to check dtype per column.
df.dtypesproduct str
quantity int64
unit_price int64
dtype: objectThe dtype: object at the bottom is the dtype of the Series that dtypes itself returns, and everything above it is the dtype of each column. product is str, and quantity and unit_price are int64.
Start with info()
df.info()<class 'pandas.DataFrame'>
RangeIndex: 3 entries, 0 to 2
Data columns (total 3 columns):
# Column Non-Null Count Dtype
--- ------ -------------- -----
0 product 3 non-null str
1 quantity 3 non-null int64
2 unit_price 3 non-null int64
dtypes: int64(2), str(1)
memory usage: 204.0 bytesThis sums up the index, column info, whether there are missing values, dtypes, and even memory usage all at once.
This isn’t information for analysis itself. But you need to know it before you can do any analysis. So when I get a DataFrame, I run df.info() first. I’m checking what the table I’m about to analyze looks like before anything else.
When I actually put in an empty value and ran info(), it showed up directly in the Non-Null Count. The only thing that decreases here is the non-null count, so you need to know exactly how many entries there are in total. If you don’t know the entry count, you can’t tell that the non-null count has dropped.
If a column that should only contain integers shows up as
float, you can guess that it containsNaN.
Transpose
df.T swaps the positions of rows and columns.
Exploration
| Function | What it does |
|---|---|
df.head() | First 5 |
df.tail() | Last 5 |
df.sample() | Pick at random (1 by default) |
df.describe() | Descriptive statistics |
df.nunique() | Number of unique values per column |
sample() returns different results every time you call it. To fix the randomness, give a seed to random_state.
orders.sample(2, random_state=42)Running this multiple times gives the same result every time. It’s the same on a different computer, too. I checked in Colab and confirmed that the same seed produces the same values.
You can also pull out by ratio instead of count.
orders.sample(frac=0.25)describe()
describe() gives you count, mean, min, max, Q1, Q3, median, and standard deviation. std is the standard deviation. count is the count excluding missing values. Descriptive statistics also show up for date data.
To see only the columns you want, append describe() to the result of selecting columns.
orders[
    ['quantity', 'unit_price', 'discount_rate']
].describe()
It seems str columns get automatically excluded.
nunique()
orders.nunique()order_date 10
customer 5
region 3
product 3
quantity 5
unit_price 3
discount_rate 3
paid 2
dtype: int64This gets used a lot with categorical data — to check whether something that’s supposed to be categorical really is, to check for data contamination, or to decide on an encoding method.
This connects to the encoding I learned in #1. For nominal data you use one-hot encoding, and for ordinal data you use ordinal encoding. But if you don’t know how many unique values there are, you can’t estimate how many columns one-hot encoding will blow up into.
Things to study further
- The rule
describe()uses to excludestrcolumns — it seems to exclude them automatically, but I need to confirm this. Also whether there’s a separate way to see descriptive statistics for string columns (pandasdescribe) - Descriptive statistics for date data — apparently they show up for dates too, but what does a mean date or a standard deviation even mean here
- Catching outliers with Q1 / Q3 — I left as homework in #1 where to cut outliers, and
describe()already gives Q1 and Q3. I’ll follow up here with how to set boundaries using IQR - Things to watch out for when attaching a derived variable — I confirmed that
df['total'] = ...attaches fine, but I’ve heard that attaching to a slice of the original DataFrame triggers a warning. When does it become a copy and when does it stay the original - When to care about
memory usage— it shows up ininfo(), but my current data is small enough that I have no feel for it. At what scale does it become necessary to change dtypes to reduce memory nandfracinsample()— in what actual situations you’d choose pulling by count versus by ratio