
I moved on to actual analysis with the Iris dataset. The instructor shared the csv that’s available from scikit-learn, so I used that. Thanks to the Rainbow CSV extension I’d already installed, it was easy to read since the columns were color-coded.
Table of contents
Open Table of contents
Reading the csv
Normally in Python, to read a file you’d use open, plus os or pathlib. pandas has read_csv, so none of that is needed.
I keep the file location in a variable and pull it out when needed. A variable you create once and never change is called a constant-like variable, and it’s usually written in uppercase. I gave the path as a relative path.
df = pd.read_csv(IRIS_CSV_PATH)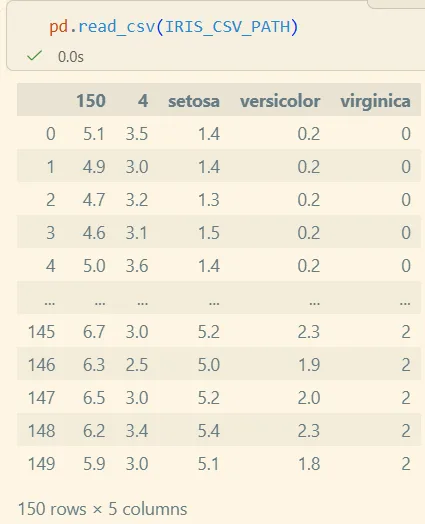
It did load as a DataFrame, but the table looks off.
The first row was taken as column names
As I learned in #4, I checked shape first. The first line of the csv had been taken as column names. Sitting in the header position were 150, 4, setosa, versicolor, virginica.
So I made it skip the first line.
df = pd.read_csv(
    IRIS_CSV_PATH,
    skiprows=1,
)
But csv still kept trying to treat the first line as a title. This time, the first row of actual data became the column names. You need to set header to None.
df = pd.read_csv(
    IRIS_CSV_PATH,
    skiprows=1,
    header=None,
)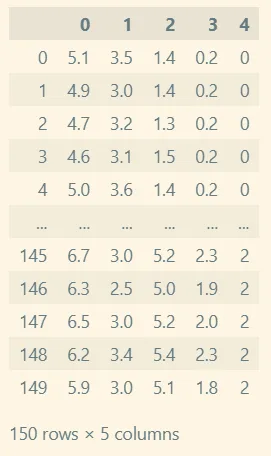
This way, all 150 rows come in without loss. But since there are no column names, you have to give them yourself. The Iris dataset has sepal length and width, petal length and width, and species. Since these values won’t change during analysis, I made them a constant-like variable.
IRIS_COLUMNS = [
    "sepal_length", "sepal_width",              # sepal length, width
    "petal_length", "petal_width", "species",   # petal length, width
]

df = pd.read_csv(
    IRIS_CSV_PATH,
    skiprows=1,
    header=None,
    names=IRIS_COLUMNS,
)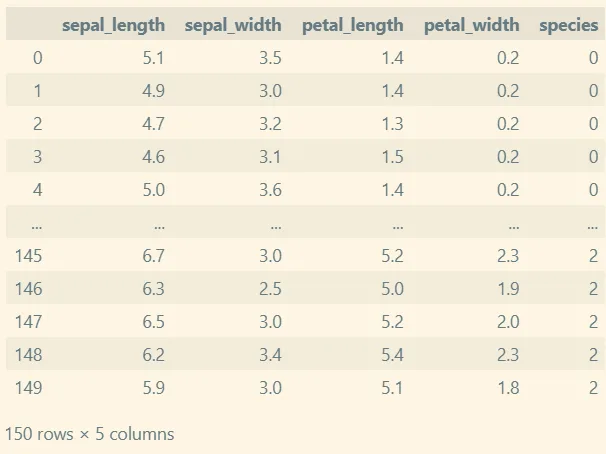
Now I can call info() and describe().
You can also pull the data directly from scikit-learn instead of getting a csv. After
from sklearn.datasets import load_iris, callload_iris()and put that data into a DataFrame.
Checking for missing values separately
Even if df.info() shows no missing values, it’s good to confirm for certain.
df.isna()         # whether each cell is missing
df.isna().sum()   # how many missing values per attribute
Adding sum() gives you a direct count of missing values per attribute.
Even with df.sample(n=5) for random sampling, the sample can be skewed, so you shouldn’t judge based on the sample alone.
describe() even shows species
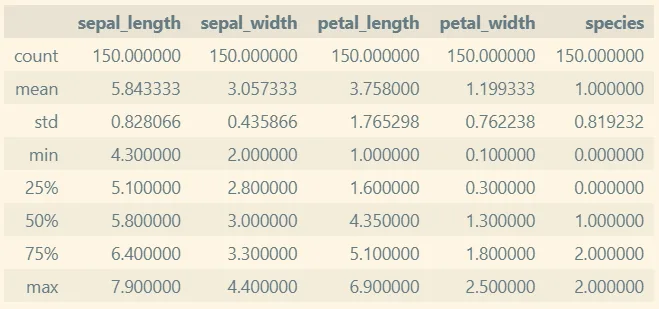
species shows a mean and standard deviation too. Species is categorical, so descriptive statistics aren’t meaningful for it, yet they still get calculated. This is because the values are stored as the numbers 0 · 1 · 2, so pandas treats them as numeric.
This is the same story as the identifier trap I learned in #1. Looking like a number doesn’t mean it’s a quantity.
What to look at in descriptive statistics
| What | Why | Metrics |
|---|---|---|
| Central tendency | Where the data clusters | mean · median · mode |
| Dispersion | How spread out the data is | variance · standard deviation · quartile |
| Shape of distribution | What shape the data takes | skewness · kurtosis |
- Mean: the sum of all values divided by the count
- Median: the value exactly in the middle when sorted by size
- Mode: the value that appears most frequently
- Variance: the average of the squared deviations from the mean
- Standard deviation: the positive square root of the variance
- Quartile: the value at a position dividing the whole into four parts
- Skewness: how much the distribution leans to one side
- Kurtosis: how sharp or pointed the distribution is
Looking at these lets you spot outliers.
To see the median of a single column, pull that column out as a Series and call median().
df["sepal_width"].median()np.float64(3.0)It comes out as np.float64, not Python’s float. I’m told this is for precision.
Derived variables — keep the original, copy first
I made a derived variable to make the categorical data readable. First, I mapped species numbers to iris names in a dictionary.
The important part is leaving the original untouched and attaching the derived variable to a copy. Use df.copy().
There are two kinds of copying.
- Shallow copy — copies only the address (a reference)
- Deep copy — copies the data as well
df.copy() creates something entirely new.
Series has map(). If you pass in a mapping dictionary, it replaces each value with the string for the corresponding key.
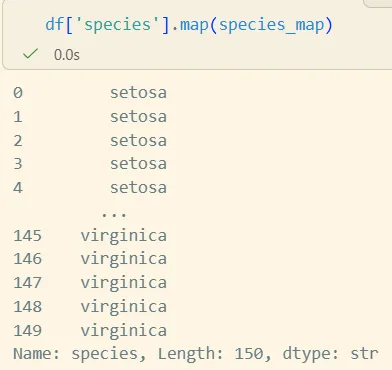
Putting this into a new column gives a DataFrame with a derived variable attached.
species_df['species_code'] = df['species'].map(species_map)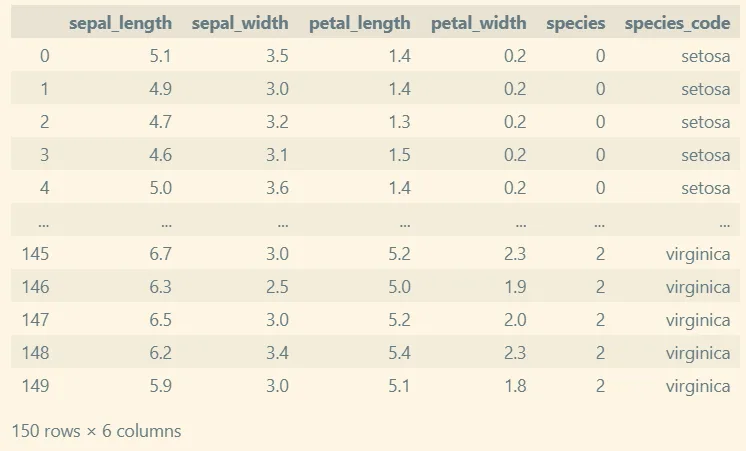
When computing totals or averages, you can add columns to the DataFrame like this and use them. Now that I know how to attach derived variables, what I’ve learned so far is enough to start doing analysis.
Counting by category
To see how many of each category there are, use value_counts().
species_df['species'].value_counts()species
0 50
1 50
2 50
Name: count, dtype: int64If you want percentages, set normalize=True.
species_df['species'].value_counts(normalize=True)What’s still unresolved — “unknown”
If missing values are stored as the string "unknown", they look like missing values to us, but not to the program. Running isna() returns False for all of them.
I checked this much but didn’t get to resolve it.
Things to study further
- Handling missing values disguised as strings — how to turn values that only look missing to a human — like
"unknown"·"N/A"· empty strings — into actually missing values. This is a real-world case of what I learned in #1 about inconsistent missing-value markers. I heardread_csvhas anna_valuesargument. - Why it comes out as
np.float64— I heard it’s for precision, but I need to check what actually differs from Python’sfloat. This seems to lead into the relationship between numpy types and Python types. - How to display a column that’s categorical but stored as numbers — to keep
speciesfrom being included indescribe(), it seems I’ll need to change its dtype. I heard pandas has acategorydtype (pandas categorical). - How to actually read skewness and kurtosis — I learned the names and definitions, but I don’t know what value counts as “skewed.”
- The relationship between
skiprowsandheader— I should write up why I had to give both. Why, with onlyskiprows, does the next line become a header again? (pandasread_csv) - Cases where shallow copy causes problems — I was taught to use
df.copy(), but I want to reproduce for myself what actually goes wrong if you don’t.